|
This course was an introduction to Educational Fieldwork and my first course in the Professional Master of Education Program. It has been seven years since I was last in University, I graduated with my Special Education Diploma in 2016 from UBC. Technology has improved since that time making it easier to access databases and articles for research. Navigating through the OnQ system and getting back into reading research articles and writing discussion posts has been a challenge! Thank goodness I started in the summer when I didn't have to worry about working at the same time. The downside of starting in the summer is the weather is gorgeous and I want to just be outside playing. Scheduling time to work on the course has been important and I will plan for that during the fall and winter terms as well.
0 Comments
Wow this was totally new for me. I am not a creative person so I really appreciate having templates to start from rather than building an infographic from a blank page. The challenge I see with infographics and info-posters is to have enough information for the audience but not so much that it's overwhelming. Looking forward to your feedback as this will make up a portion of my final poster project.
https://infograph.venngage.com/ps/lQOmneBCe4Y/effective-classroom-environments-for-student-learning-infographic
Data Analysis Reflection Tanya N. Kerr Queen’s University PME 984: Introduction to Educational Fieldwork Abstract This data analysis reflection demonstrates my emerging capacity to analyze quantitative and qualitative data. I have reflected on my learning about quantitative and qualitative data in relation to your professional context and the problem of practice/inquiry questions I identified in Module 2, What changes to the environment in a Secondary science classroom improve student focus? Which data sources (quantitative or qualitative) are most valued in my professional context?As a Secondary teacher, both quantitative and qualitative data sources can be valuable in various ways. Different data sources provide different insights and can help teachers make informed decisions about their teaching strategies, curriculum, and student support. Some examples of valued quantitative data sources for Secondary teachers include assessment data such as standardized test scores, quizzes and exams, attendance records to identify patterns of absenteeism, behaviour records to track incidents and student surveys. Qualitative data source examples could include classroom observations such as students’ interactions and participation, one-on-one conversations during student-teacher conferences, reflective student journals and parent-teacher feedback. Both quantitative and qualitative data are essential for a comprehensive understanding of student performance, needs, and growth. They complement each other and can help teachers tailor their instructional practices to better meet the diverse needs of their students. By combining insights from different data sources, teachers can create effective teaching strategies and foster a supportive learning environment for their students. Module 2 data sourcesMy inquiry question from Module 2 was What changes to the environment in a Secondary science classroom improve student focus? The interview questions for teachers would fit well as qualitative data sources as there’s likely to be only a few interviews with open-ended questions. It’s possible that question number two in the interview could be analyzed quantitatively and a graph constructed based on the factors that teachers believe to contribute to distractions in the science classroom. Below I have included a sample pie chart which shows distractions in the classroom. Another question that fits with quantitative data analysis is the first part of question three, have you ever experimented with flexible seating arrangements or alternative classroom setups? Responses to this question would generally be yes or no. Any elaboration to the question or the second part of the question would best fit with qualitative data analysis. Study Tallies Time Off Task in Elementary Classrooms (edweek.org) The survey questions for students would mostly be analyzed quantitatively with the exceptions of questions four through seven where students may provide long answer responses. Scope of data collectionI identified in my instrument development in Module 2 that I would be collecting data from mainly students and classroom teachers. The interview questions are designed for classroom teachers and may be adapted to include ELL teachers, resource teachers, special education assistants and youth care workers. The survey is designed for students and can be adapted for adults as well. Supporting Equity, Diversity, Inclusion, and Decolonization (EDID) principles in data collection is essential to ensure that the data collected is representative, respectful, and free from biases. Some strategies to support EDID principles in data collection I would consider are as follows:1. Diverse and Representative Sample: Aim to collect data from diverse and representative populations. Ensure that my sample includes individuals from different ethnicities, races, genders, sexual orientations, socioeconomic backgrounds, and abilities. This will help avoid biases and provide a more comprehensive understanding of the population being studied.2. Informed Consent: Prioritize informed consent from participants, ensuring they fully understand the purpose of the data collection and how their information will be used. Provide information in multiple languages if necessary, and take into consideration cultural sensitivities.3. Culturally Appropriate Data Collection: Tailor data collection methods to be culturally appropriate and sensitive. Avoid using language or questions that might be offensive or disrespectful to certain groups. I would work with community representatives or experts to ensure that data collection tools are respectful and inclusive.4. Intersectionality: Recognize and consider intersectionality in data collection. Intersectionality acknowledges that an individual's identity is shaped by the intersection of multiple social categories, such as race, gender, and class. Analyzing data through an intersectional lens allows for a more nuanced understanding of how different social identities intersect and impact experiences and outcomes.5. Decolonize Research Frameworks: Challenge and question traditional research frameworks and methodologies that may have colonial or oppressive origins. Consider indigenous research methodologies and other alternative approaches that prioritize the knowledge and perspectives of marginalized communities.6. Data Anonymization and Privacy: Protect the privacy and confidentiality of participants' data, especially when dealing with vulnerable or marginalized populations. Ensure data anonymization and aggregation to prevent the identification of individuals or groups.7. Collaborative and Participatory Research: Engage with communities and stakeholders throughout the research process. Involve them in decision-making, design, and interpretation of results. This participatory approach ensures that data collection reflects the needs and interests of the communities being studied.8. Address Biases and Assumptions: Be aware of my own biases and assumptions during data collection. Regularly reflect on how these biases might influence the data collection process and take steps to mitigate their impact. This is especially important when using qualitative data analysis.9. Transparent Reporting: Be transparent in reporting the limitations and potential biases in the data collected. This transparency helps readers and researchers interpret the results accurately and understand the context in which data was collected.10. Ongoing Evaluation: Continuously evaluate and improve data collection practices through feedback and learning from the communities involved. Adapt methodologies to better align with EDID principles based on these learnings.By adhering to these strategies, we can ensure that our data collection processes are more inclusive, respectful, and aligned with EDID principles. This approach leads to more robust and ethical research outcomes that benefit society as a whole. Data collection would occur once a semester for students and once a year for adults. If any adaptations were made to the classroom environment during a semester, there could be a brief survey constructed to compare the changes and their effectiveness for students.Feasibly I could collect data from my own students each semester which would be approximately 96 students and select ten adults for interviews. If I had support from other teachers with this research we could increase our scope for data collection. Including others in the research collection and analysis could introduce additional sources of variance (Aidley, 2018) so having a control and practice together would be important. Analyzing collected dataClearly articulating the inquiry question is the beginning of the process. What changes to the classroom environment positively impact student focus in Secondary science classrooms?Beyond the interview and survey questions, other data to collect that is relevant to address the research question may include quantitative data (e.g., test scores and attendance records) and qualitative data (e.g., observations, student and teacher interviews, and focus group discussions).Clean and preprocess the data to ensure its quality and readiness for analysis. This step involves removing any outliers or errors, handling missing data, and transforming the data if necessary (Zhu et al., 2013).Use appropriate statistical methods to analyze quantitative data. For instance, I can conduct descriptive statistics to understand the distribution of variables and calculate measures of central tendency and variability. I can also perform inferential statistics (e.g., t-tests, ANOVA) to identify significant differences between groups or conditions. (Aidley, 2018)Thoroughly analyze the qualitative data using qualitative research methods like thematic analysis or content analysis. This process involves identifying recurring themes, patterns, and insights from the interviews, observations, and focus group discussions related to student focus in the science classroom.Integrate the findings from both quantitative and qualitative analyses to get a comprehensive understanding of how changes in the environment impact student focus.Look for trends and patterns in the data that suggest specific changes in the classroom environment leading to improved student focus. Are there any particular classroom arrangements, lighting conditions, seating configurations, or instructional strategies that appear to positively impact student focus? Examine if there are any correlations between different environmental factors and student focus.Involve teachers, students, and other stakeholders in the analysis process. Seek their input and perspectives on the data findings to gain a more holistic view.Based on the analysis, draw conclusions about the changes that seem to have a positive impact on student focus in the Secondary science classroom. Generate actionable recommendations for educators to implement based on the data-driven insights.The process of improving the classroom environment should be ongoing. Monitor the changes implemented and collect additional data to evaluate the long-term impact and make further adjustments as needed. Challenges collecting and analyzing dataCollecting and analyzing data to understand how changes to the environment in a Secondary science classroom improve student focus can indeed present some challenges. There might be biases in the data collection process, such as non-response bias in surveys or observer bias during classroom observations. To navigate this challenge, ensure that data collection methods are carefully designed, and participants are encouraged to provide honest and diverse responses. Use random sampling techniques when possible to reduce bias in the sample. In some cases, obtaining a large and representative sample might be challenging, especially in a school setting. A small sample size could limit the generalizability of the findings. If the sample size is small, I would consider using qualitative research methods to gain more in-depth insights from a smaller group of participants. Additionally, I could consider collaborating with multiple schools or classrooms to increase the sample size.When collecting data involving students, it is crucial to prioritize their privacy and obtain proper consent from parents or legal guardians. Ensure that data is anonymized and aggregated to protect the identity of individual students. Comply with ethical guidelines and school board requirements. I need to seek permission to perform this research from the district principal who oversees research in the district.The classroom environment is a complex system with numerous interacting factors that can influence student focus. Identifying the specific factors responsible for changes in student focus might be challenging. Another aspect is the limited time available for such research. Instructional time is always a challenge to ensure the curriculum and key skills are taught and students have enough time to practice. The importance of this research could help maximize the time students have within the classroom making the research a valuable use of time.Analyzing qualitative data, such as interview responses or observations, can be subjective. To address this, I would consider using multiple researchers or coders to analyze the data independently and then compare and discuss their findings to reach a consensus on the interpretations. Data collection and analysis require time, effort, and resources. We may have limited capacity for conducting extensive research. To navigate this challenge, collaborate with researchers, educational institutions, or organizations that can provide support and resources for data collection and analysis.Measuring the long-term impact of changes in the environment on student focus may require longitudinal studies, which can be time-consuming and resource-intensive. Plan for follow-up data collection over an extended period to assess the sustainability of the observed changes. Implementing changes in the classroom environment may face resistance from teachers, students, or school administrators. To address this challenge, involve stakeholders in the decision-making process and communicate the potential benefits of the changes based on data-driven evidence.By proactively considering these challenges and implementing strategies to navigate them, we can enhance the quality and reliability of the data collected and the subsequent analysis. This, in turn, will lead to more informed decisions and effective improvements in the Secondary science classroom to enhance student focus.References Aidley, D. (2018). Introducing quantitative methods: A practical guide. Red Globe. Chapter 6: Basic concepts of data description and analysis (pp. 155-190). Kurtz, Holly. (2014, 05 05) Study Tallies Time Off Task in Elementary Classrooms. Education Week. Study Tallies Time Off Task in Elementary Classrooms (edweek.org) Morris, A. (2015). A practical introduction to in-depth interviewing (pp.121-137). Sage. Chapter 8: Transcribing, analysing and writing up the interviews. Zhu, Y., Hernandez, LadiaM., Mueller, P., Dong, Y., & Forman, MicheleR. (2013). Data Acquisition and Preprocessing in Studies on Humans: What is Not Taught in Statistics Classes? The American Statistician, 67(4), 235–241. https://doi.org/10.1080/00031305.2013.842498 Following the supplemental guide working through the quantitative data in excel my average calculation resulted in 4 instead of 4.43. I remembered that you must format the cells to include decimal points when using numbers. If you keep the format general, then you would get decimals in your answer. I tried to recreate the pie chart in excel but had difficulty selecting the appropriate data. I’ve included a screenshot to show my error. I used Excel frequently during my undergraduate degree in Chemistry however that was many years ago, Excel has changed over the years and the data I was using at the time was based on experimental measurements, as opposed to survey data from people. Coming from a numbers background I see the value of quantitative data analysis and the types of responses that it is appropriate for. Demographic data and simple responses fit best with quantitative data analysis. Reading through the qualitative analysis supplemental guide and data transcript I can see how time consuming this process could be. I’m curious on the technology that was used to transcribe the interview. If it was a person listening to a recording and typing out what was said, would you include the “ums and uhs”? My experience reviewing surveys with written responses is to highlight key points and take notes on themes. I understand when to use qualitative data analysis but would like to know approximate timelines on these kinds of interviews. I also wonder about the bias we have as the researcher interpreting the data and don’t know if Morris (2015) addressed that issue with enough depth to fully comprehend. Sources: Aidley, D. (2018). Introducing quantitative methods: A practical guide. Red Globe. Chapter 6: Basic concepts of data description and analysis (pp. 155-190). Morris, A. (2015). A practical introduction to in-depth interviewing (pp.121-137). Sage. Chapter 8: Transcribing, analysing and writing up the interviews. 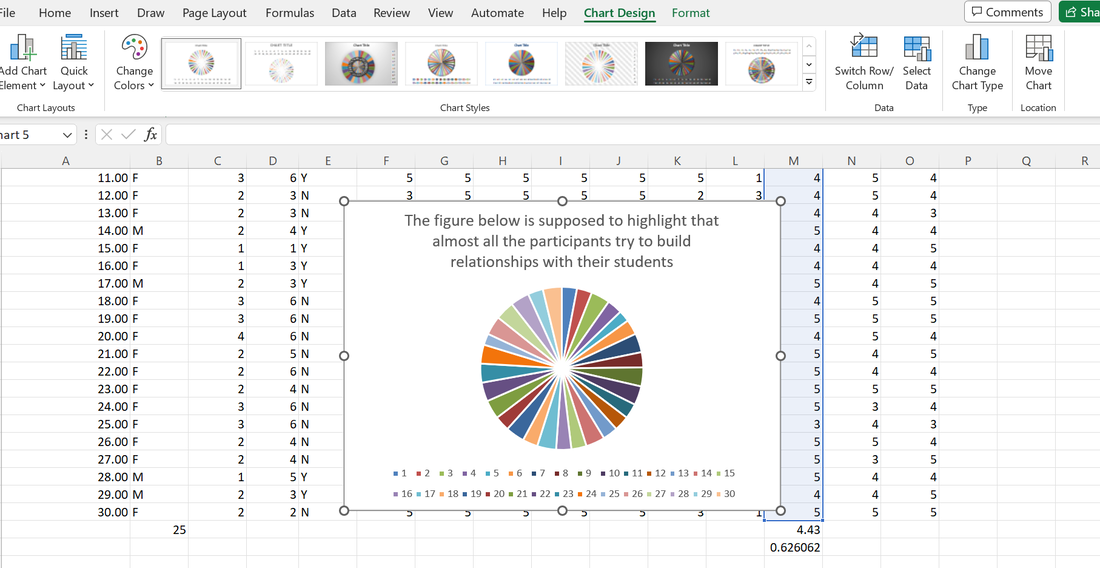 |
AuthorTanya Kerr is a current student of Queen's University Graduate studies. Archives
September 2023
Categories |
 RSS Feed
